


Listen now
.svg)


Last month, we celebrate the 3rd birthday of Q, NGP’s proprietary AI platform powering company and market discovery. We took the decision to invest into an internal data platform due to many reasons, but the driving factor was to change our stance from reactive to proactive: being able to move ahead of the market, and to have a full picture of the market before companies, investments and outcomes are known facts.
The second most important decision we made right after, was to build the platform in a way where the data would be at our fingertips. Having a separate tool for data exploration is often helpful, but in order for the team to gain full benefit, everyone needs to actively use the toolkit. Therefore, we decided to knit the data closely with pipeline management.
What lies under the Q-hood?
Technologically, we split Q into 3 stages: firstly, we source data that is relevant for our decision-making, resulting in around 700 data points per company. The key in sourcing data is to minimize effort: we don’t believe we can build a unique dataset ourselves. Secondly, we model the data and build machine-learning models to support decision-making. The key concepts here are entity recognition and label data: how do we recognize an entity as ubiquitous as a growth company, and how can we create training data to predict great (and not-so-great) outcomes. Thirdly, as we strongly believe data needs to be at the team’s fingertips, we’ve put a lot of attention in integrating data with both existing and new workflows and made sure Q also proactively pushes interesting data and events to the team.
How does Q help in making great investments?
To fully appreciate the impact of Q, we took a look at our company universe as a waterfall. We start from a base set of around 2,5 million technology startup companies, from which we want to identify ones that could be investment prospects for NGP. The space of investable companies in the early growth stage is much smaller, and often, I’ve heard the argument to focus on 10 000 or 100 000 most promising companies. However, you can’t know what good looks like before you know about some good (and bad) outcomes. Predicting outcomes makes sense only when you know what has happened previously.
We tend to think of Q narrowing down the company space in two stages: first focused on company fit with investment strategy, and second focused on the momentum and financial prospects. The graph below illustrates how we use both together to narrow our universe down from 2,5 million technology startups to ultimately 7000 companies we find investable based on Q. Though not a small pool of companies, this is a set of well-curated companies that we nearly without exception find interesting.
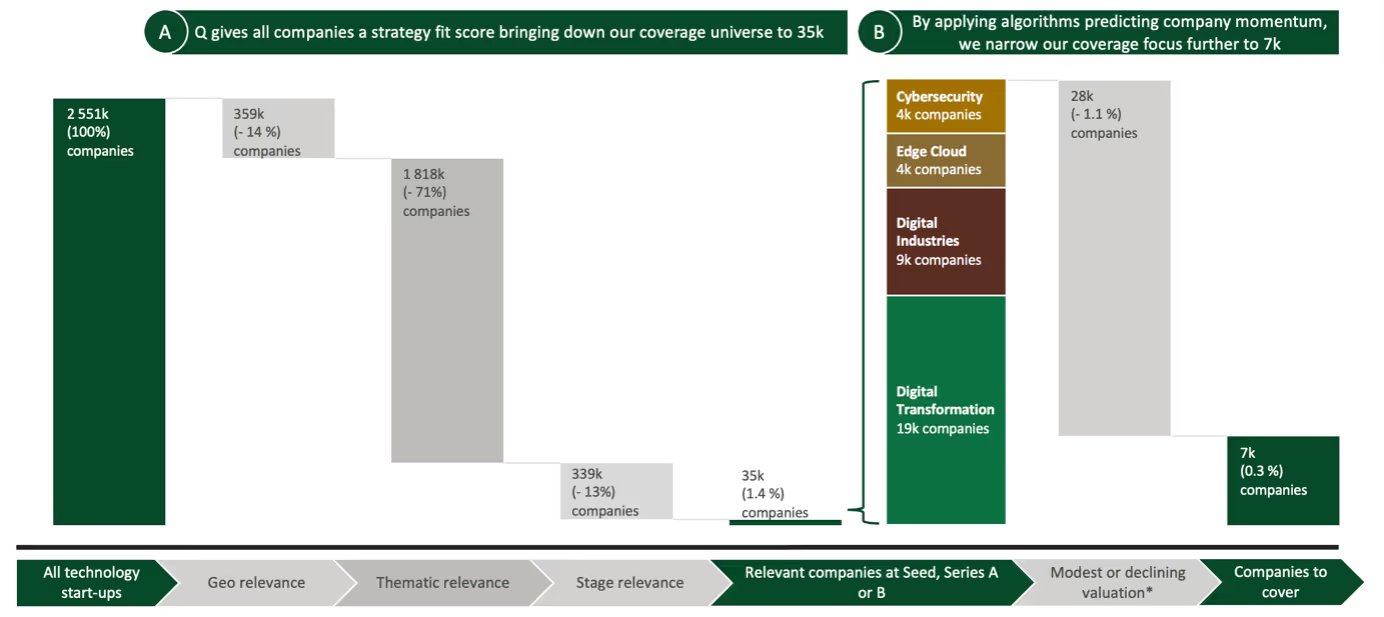
The first stage, fit with investment strategy, means fit with the geographies and company stage we typically invest in. Furthermore, we have the criteria of thematic relevance. It means that the company needs to do the kind of things we invest in, mostly being a software product company within themes of Cybersecurity, Edge Cloud, Digital Industries and Digital Transformation. Based on textual and categorical data on companies, we can predict whether a company will be relevant to any of them, as well as which is the strongest association if there are multiple relevant ones. Applying all these filters down, we are down from a total of 35 000 companies.
The second stage, company momentum, means that we need to be able to generate returns for our investment. The best way we’ve found to approximate this is to find companies that have an increased valuation. As we know valuation data is not readily accessible and materializes only at funding or exit events, we work around this by predicting a what-if valuation for all companies at any given moment (including one year in the future!) Training data includes all momentum-related alternate data that we’ve managed to build into our models. Looking for sufficiently increasing valuation brings us down from 35 000 strategic fit companies to the ultimately investable 7 000 companies.
When looking at different alternate data points and trying to consolidate all the information, the biggest problem isn’t a scarcity of data - vice versa, there’s actually a lot of data, and we need to understand the relative importance of each data point and time series. Due to this issue, we’ve decided to try and squeeze as much information as possible to three headline scores that we call the Q Scores.
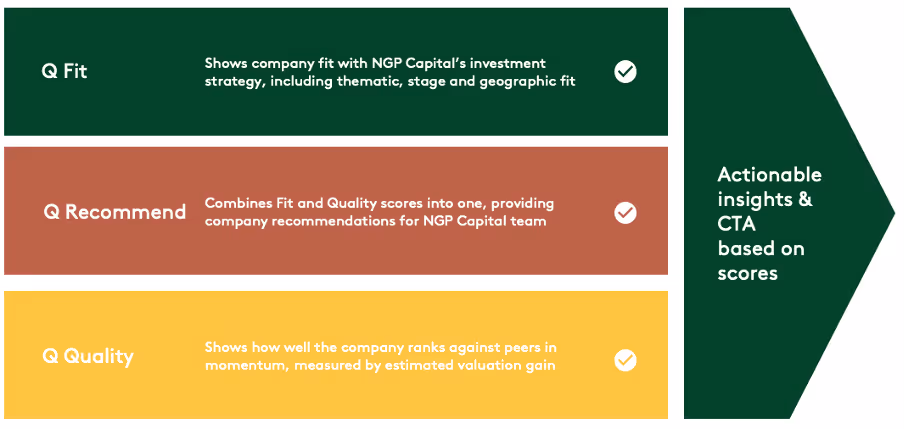
Even if 7 000 companies are less than half a percent of 2,5 million, it’s still a lot of companies for the team to review. Therefore, the scores provide us with an easy way to sort and filter companies and to quickly get a first impression of any company in the database. Usually, we want to focus on the top of any list, but we naturally most often complement it with other filters, such as geographies when traveling, company lists when attending events, markets, and industries when doing research, and so on. On the other hand, Q uses these scores to proactively push companies to the team, as well as monitor progress over time.
What has Q achieved for us?
What has Q accomplished for us, then? Over 70% of our dealflow now originates from Q: Q serves both as a data exploration tool for our team, as well as proactively pushes interesting companies for the team to review.
It’s important to note that Q hasn’t fully replaced the more traditional channels though: 20-30% of companies we review originate from sources such as inbound, events and internal research. Mentioning internal research brings us to an interesting note: sources for evaluated companies tend to consolidate, with one source often being a trigger for an investment prospect we had already flagged for monitoring.
Finally, we need to be explicit that Q is an aide, not a decision-maker. Even based on data from Q, we have 7 000 companies to look into. In our view, Q is a tool for company sourcing and monitoring, but we would never make an investment based solely on Q. When doing diligence, Q certainly helps, but private data directly from the companies tends to take the driver's seat. Being a data-driven investor means also tracking and learning from our own process, and based on what we see in actuals, the conversion rate from initial review to investment is less than half a percent!
Does Q make us more or less biased?
Venture Capital - to a high degree - is a cottage industry. We have some quite structured frameworks for evaluating investments, but we do also have individual rules of thumb, such as “I trust in founders who went to school at X”, or “I want to back founders with a sports background”. These rules of thumb do not necessarily have a maleficent origin, but being based on pattern recognition, they often amplify bias. This is perhaps most disturbingly seen in outcomes. Two data points highlight this: female founders raise around 2 % of venture funding, and black founders an equally disappointing 1,2 %, Naturally, the big question for using AI is whether algorithms amplify or mitigate these biases.
We do know that algorithms can help us solve some biases, but we similarly need to be aware that they tend to reinforce biases that are present in the training data. Let’s start from the good side: we naturally don’t have any variables that would result in unfair bias built into our models. Therefore, we wouldn’t explicitly score male founders higher than females, even in a case where it could theoretically result in a better model fit. However, the explicit is only part of the problem. We do know that biases will present via proxy variables: since we search for momentum, if some demographies have higher momentum from earlier stages, our models will learn bias via proxy, which is only marginally better than learning it directly.
What’s next for Q, then?
Q is - and will always be - a work in progress. What does the future have in mind for Q then? Of course more of everything - more data points, more companies, more usage. On top of that, we’ve noticed that there are two paradigms for a VC data platform: an analytics platform and a search platform. We now think we are doing quite well in the former, so it’s a good time to take a stab at the latter!
PS: I'll leave you with a photo of the cake we bought for Q to celebrate!

Related articles

Hype check: Why self-driving cars’ long-term impact is underestimated


The secret to keeping a large global business agile

Full speed ahead: When it comes to connected car technology, Europe is among the best in class